
Page 7 - 2022 IRMSA Risk Report
P. 7
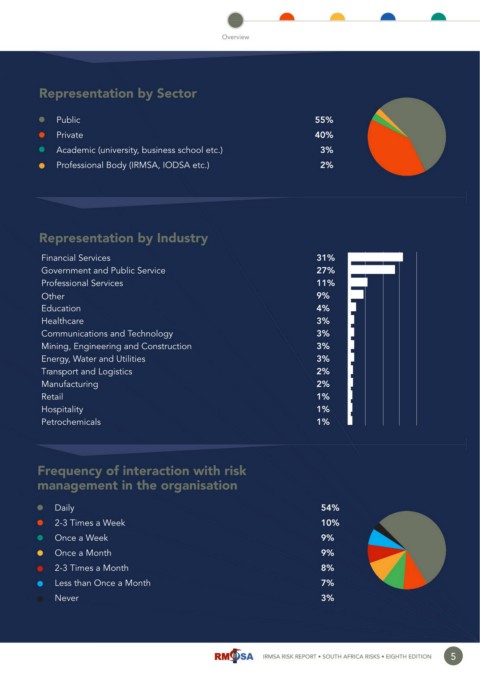
Overview
Representation by Sector
*ÕLV 55%
*ÀÛ>Ìi 40%
ƂV>`iV ÕÛiÀÃÌÞ] LÕÃiÃÃ ÃV
iÌV°® 3%
*ÀviÃÃ> `Þ , -Ƃ] " -Ƃ iÌV°® 2%
Representation by Industry
>V> -iÀÛVià 31%
GoveriÌ >` *ÕLV -iÀÛVi 27%
*ÀviÃÃ> -iÀÛVià 11%
Other 9%
Education 4%
i>Ì
V>re 3%
Communications and TiV
}y 3%
Mining, Engineering and Construction 3%
Energy, W>ÌiÀ >` 1ÌÌis 3%
Transport and Logistics 2%
Manufacturing 2%
Retai 1%
ëÌ>ÌÞ 1%
*iÌÀV
iV>s 1%
Frequency of interaction with risk
management in the organisation
>Þ 54%
ÓÎ /ià > 7ii 10%
Once a Week 9%
Once a Month 9%
ÓÎ /ià > Ì
8%
Less than Once a Month 7%
Never 3%
IRMSA RISK REPORT • SOUTH AFRICA RISKS • EIGHTH EDITION 5